On-Chain Data School (Part Four): Visualizing BTC UTXO Age Price Distribution Chart


Original Article Title: "On-chain Data Classroom (Part 4): Visualizing the $BTC Chip Price Distribution Chart "
Original Article Author: Mr. Berg, On-chain Data Analyst
This article is the 4th in the On-chain Data Classroom series, which consists of 10 articles in total. Take you step by step to understand on-chain data analysis. Interested readers are welcome to follow this series of articles.
Related Reading: "On-chain Data Classroom (Part 3): Have the Bottom Fishing Whales Taken Profit?"
TLDR
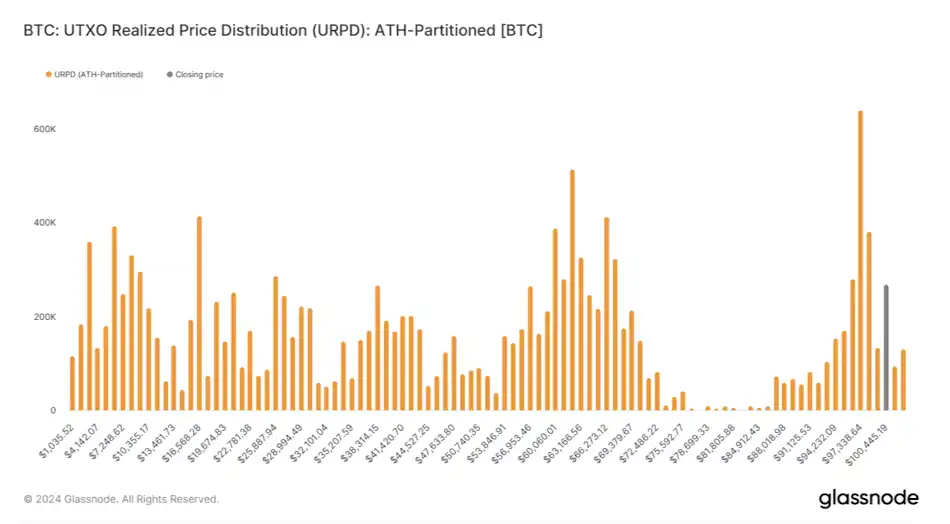
- This article will introduce the on-chain metric URPD
- URPD shows the distribution of $BTC chips at different holding costs
- URPD can be used to observe chip turnover, distribution conditions, and provide guidance on trends
What is URPD?
URPD, short for UTXO Realized Price Distribution.
Due to BTC's unique UTXO blockchain structure,
we can track data on-chain that is unavailable in traditional financial markets.
The URPD chart is an indicator derived from this principle,
where we can see the number of chips corresponding to each price level on the chart,
equivalent to showing the "buying cost of each $BTC."
URPD, Chip Turnover, Accumulation, and Distribution
After understanding the concept of URPD,
we can then observe the turnover of chips at different price levels based on the daily URPD changes.
For example:
Chart one below is the URPD chart for May 1,
while chart two is the URPD chart for October 1.
After experiencing five months of wide-ranging fluctuations in price,
It is quite obvious to see the phenomenon of low-cost chips being distributed upwards.

URPD, Chip Turnover, Accumulation, and Distribution (2)
In history, at a market top, it is usually accompanied by the tail end of high-profit low-cost chip distribution;
while at a market bottom, a large amount of chips can be seen accumulating in a relatively narrow range.
Therefore, in analysis,
URPD is often observed together with other data (such as realized profit, MVRV, etc.),
integrating logical thinking to understand the market from a more comprehensive perspective.

Support, Resistance, Consensus
When a significant amount of chips begins to accumulate in a single price range,
it indicates that a supply-demand consensus has gradually formed in that range.
Once the price later rapidly rises out of that range,
due to the high turnover of chips in that range,
it is likely to provide support in the future;
Conversely, if the price falls below that range,
the chips in that range will become trapped chips,
which may act as resistance levels in future price increases.
Conclusion
The above is all the content of On-Chain Data School (Part Four). For readers interested in delving deeper into on-chain data analysis, remember to keep track of this series of articles!
If you want to see more analysis and educational content on on-chain data, feel free to follow my Twitter handle (X)!
Hope this article has been helpful to you. Thank you for reading.
You may also like

SharpLink CEO: How to understand that Ethereum developers have just surpassed 1 million?

Morning Report | MiCA grace period expires on July 1; Kalshi's trading volume in the first week of the World Cup breaks $5.1 billion, setting a record

The foundation of SpaceX's trillion-dollar valuation: Who is dividing Musk's annual capital expenditure of tens of billions?

How to exit after asset tokenization?

The stablecoin positioning battle escalates: When compliance is just a ticket to entry, will USD1 become the biggest winner?

A16Z: The sun bears witness, SpaceX is worth 7.5 trillion

Mergers and acquisitions in the cryptocurrency market are exceptionally active

Concerns Behind the Binance Customer Service Controversy

SpaceX Stock Prediction After the IPO: Can SPCX Reach $200 Before QQQ Inclusion?

Congratulations to Carl Moon on His Historic Ferrari Challenge Le Mans Podium Triumph
Crypto influencer and racing enthusiast Carl Moon finished third in the Ferrari Challenge Le Mans Coppa Shell class, marking his best result of the year. As his racing partner and sponsor, WEEX celebrates this remarkable achievement and continues to lead crypto’s journey beyond boundaries, uniting the innovation of digital assets with the passion of motorsport.
Can the CLARITY Act Become Law by July 4? Everything You Need to Know About the Final Battle

France vs Senegal World Cup 2026: Mbappe’s New Era Begins Against a Historic Rival
What is the connection between Huang Zheng of Pinduoduo and blockchain?

Morning Report | Prediction market platforms like Kalshi and Polymarket jointly sue Kentucky over 14.25% trading tax; Bridgewater founder discusses decision-making in the AI era: principled thinking should run parallel to AI, human insight remains irre...

If the AI bubble has already burst, who will truly remain?

Paul Graham: How to Make a Billion Dollars

After 18 years, blockchain has finally started to head towards the main channel
